SAS macro for setting optimal axis ranges
Examples
Motivation
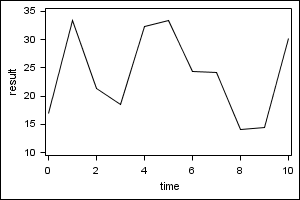
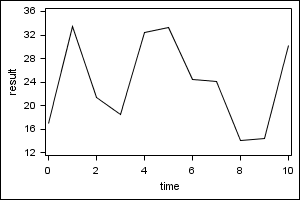
The default axes produced by SAS/GRAPH and ODS Graphics often leave something to be desired.
- In SAS/GRAPH the tendancy is towards giving too many tick marks.
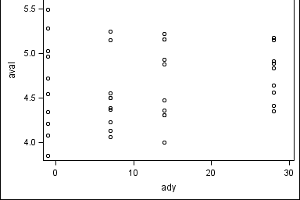
- In ODS Graphics the tendancy is to allow the min and max data values to be unbounded by tick marks.
The macro presented in these examples is one SAS programmer's attempt to improve upon these default axes.
Overview
The simplest application of this macro requires the user to pass in two things:
- A dataset
- A variable
The macro also allows the user to specify
- Multiple variables
- A list of literal values
- A desired number of tick marks
- That non-traditional increments (e.g., 1.25, 3, 8) be considered